Last Updated on September 15, 2023 by Carla Jonas
Estimated reading time: 17 minutes
The wedding industry is a big business and we’ve got the stats to prove it. About to tie the knot soon and don’t want to go overboard with the budget? Or perhaps curious to know how your wedding ceremony measures up against everyone else’s? We collected data from a wide range of wedding industry sources, together with facts and figures about everything from engagements to wedding budgets to honeymoons. Read on and find lots of wedding fun facts, how people plan their special day, propose, travel and how they save and spend when tying the knot.
General Wedding Statistics

While the wedding industry is going stronger than ever, certain factors and trends are influencing the numbers each year. Take a look at the most recent wedding fun facts and wedding statistics below, including total marriage ceremonies performed, average age when tying the knot and average wedding costs.
- The wedding industry registered a revenue of $72 billion dollars in 2016 (Market Research)
- In 2020, due to the COVID 19 pandemic, the wedding industry measured a revenue of $55.1 billion dollars (Ibis World)
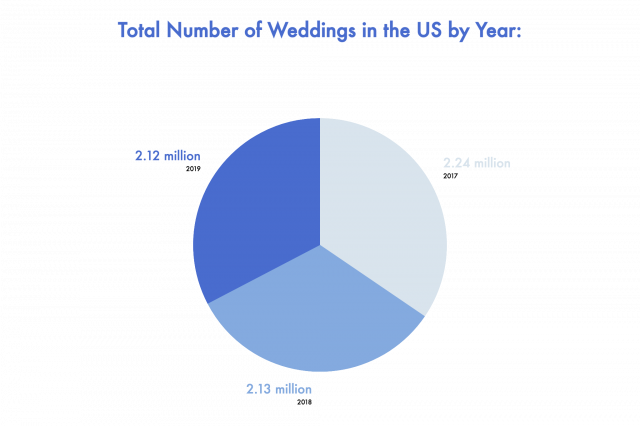
- 2019 registered a total number of 2,126,126 weddings, which means an average of 5,825 marriage ceremonies took place each day (Wedding Report)
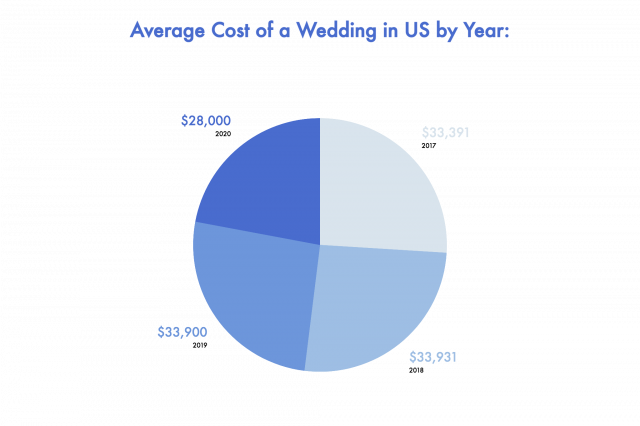
- In 2020, the average cost of a wedding is $28,000 (Wedding Wire)
- The average amount couples who tie the knot spend on décor, favors and stationery is $2,460 (Wedding Wire)
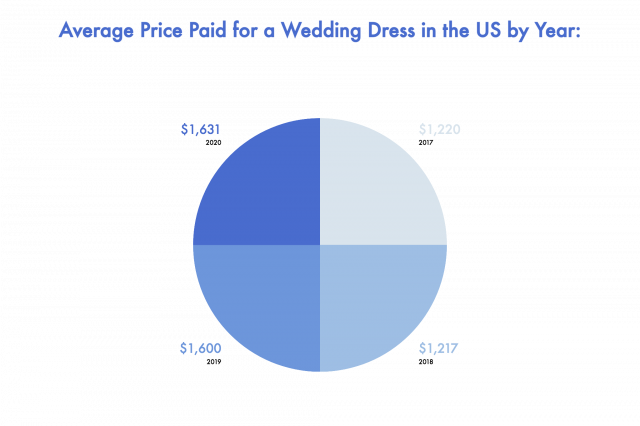
- In 2020, brides paid an average of $1,631 for a dress, including alterations (Brides)
- The average couple has a budget of around $23,000 when they begin planning, but end up spending an average of $30,000 (Wedding Wire)
- The average age at the time of tying the knot in the US is 27.8 for women and 29.8 for men (Census)
- October is the leader when it comes to the most popular time to get married (16%), followed by September (15%) and June (13%) (The Knot)
- Surveys reveal that love is the most important reason why the vast majority of Americans (88%) choose to get married (Pew Social Trends)
- The average wedding hosts 131 guests (The Knot)
Decided to tie the knot with your love? The tradition of tying the knot comes from an ancient Celtic practice called a Handfasting ceremony that involves an actual knot made out of rope or colorful ribbons joining the hands of the couple. Today, couples from many cultures opt for the Handfasting ceremony.
The Money Behind Weddings
We all know it: tying the knot doesn’t come for cheap. In the United Stated, the wedding industry generates over 60 billion dollars each year – and that figure doesn’t even include the honeymoon. How much does the average wedding cost these days? How much do guests spend and who covers the costs? Read on to find out the insider details from industry specialists.
- The vast majority of couples who tie the knot (91%) register for wedding gifts (Snipp)
- The wedding-registry gifts industry makes a whopping $19 billion every year, according to Loop Capital (Business Insider)
- In 52% of weddings, it’s the parents who cover most of the wedding costs (Wedding Wire)
- 60% of parents decide to pay for specific things, such as bridal gowns or venues, while 33% of parents write the newlyweds a check that they can spend as they please (Wedding Wire)
- Wedding guests spend around $776 for a wedding day – the statistic also includes the guests who traveled (Business Insider)
- For wedding party members, the costs are a little higher: $851 / wedding. The wedding party usually includes: the maid of honor, bridesmaids, best man, groomsmen, ushers and the parents and grandparents of the couple (Business Insider)
- The average wedding gift costs the guest around $100 (Brides)
- For guests that are close to the couple, the number is closer to $150 (Brides)
- The honeymoon industry rounds up around $12 billion dollars each year (Honeymoon Goals)
- A basic insurance policy that covers anything from loss of photos, videos, attire, gifts, rings and deposits costs the newlywed couple in between $155 and $550 (The Knot)
- In 2020, the most expensive weddings were in New Jersey, with a whopping $53,400 as the state average (The Knot)
- Other notably expensive states for the ones who tie the knot: Massachusetts ($43,600), New York ($48,600) and Rhode Island ($49,800) (The Knot)
- The average wedding was the most affordable in Utah, which rounded at $19,700 (The Knot)
- One in five couples who tie the knot in US opts for a church wedding. For the previous generation, the traditional church wedding was the go-to option for 50% of couple (The Times)
The awe-inducing photo album featuring artistic wedding day shots involves big bucks – and so does great entertainment and lush flowers. What exactly do couples who tie the knot spend their money on – and how much goes where – detailed below.
According to The Knot:
- Photographer: $2,400
- Venue: $10,500
- Event planner: $1,500
- Reception band: $3,700
- Reception DJ: $1,200
- Florist: $2,000
- Videographer: $1,800
- Wedding dress: $1,600
- Catering / person: $70
- Wedding cake: $500
- Transportation: $800
- Favors: $400
- Rehearsal dinner: $1,900
- Engagement ring: $5,900
- Invitations: $590
- Hairstylist: $110
- Makeup artist: $100
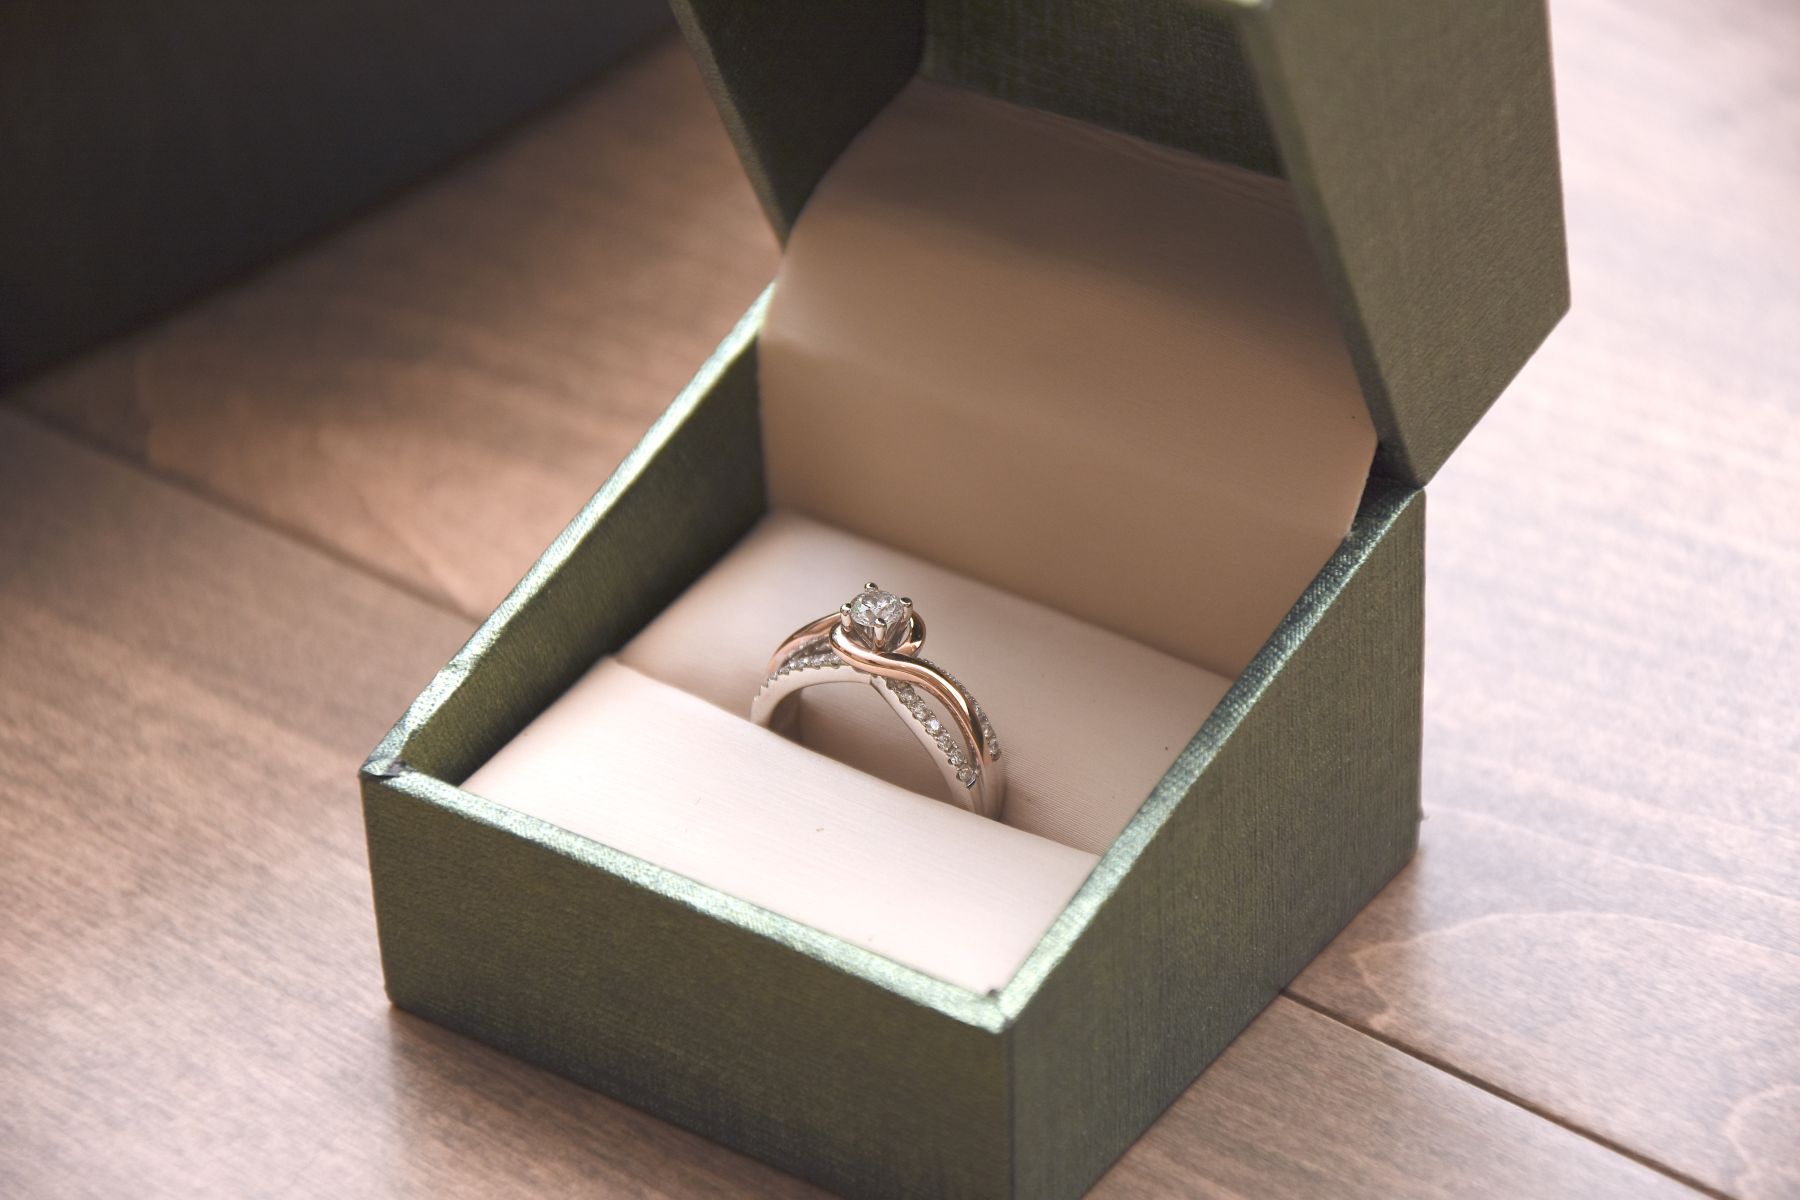
Proposal Statistics

Is romance gone or are modern men still getting down on one knee? While the stats are certainly changing each year as many couples who plan to tie the knot find their own ways to redefine romance, some things simply never change. Below are a few proposal statistics and wedding fun facts that might surprise you.
- 50% of proposers believe the proposal was a surprise to their partner, but only 33% of proposees say they didn’t expect it (The Knot)
- The average cost of an engagement ring in 2018 was $7,829 (Brides)
- In 2019, the average amount spent for an engagement ring was $5,900 (The Knot)
- Brides’ American Wedding Study showed that the average couple spends $3,756 on an engagement ring in 2020 (Brides)
- 71% of couples dated for more than two years before getting engaged (Wedding Wire)
- 67% of engaged couples are between the 25 to 34 years old (The Knot)
- Only 13% out of all proposals are spontaneous (The Knot)
- Out of all planned engagements, 40% of proposals were planned 1-3 months in advance and 17% were planned 4-6 months in advance (The Knot)
- A little over 10% of proposers ask their partner to marry them without a ring (The Knot)
- 87% of proposers say the exact words ‘Will you marry me’, while 84% get down on one knee (The Knot)
Engagement Stats
The unique engagement ring, the bling, the magic and the big ‘YES’ – they all define romance to the max. But a considerable percentage of cases show that engagements don’t always end up with tying the knot. Here are a few engagement statistics and facts from industry specialists.
- In US, the average engagement period is around 15 months (Wedding Wire).
- According to a study in which 1,000 people in the US were polled, 20 percent of all engagements were called off before the wedding (Best Life Online)
- In 2013, The Wedding Report conducted a similar study and concluded that 13% of engagements did not end with a marriage (The Wedding Report)
- 71% of the proposers select a ring less than 2 months before proposing (Wedding Wire)
- On average, proposers look at a total of 15 designs before they make their final choice (Wedding Wire)
- More than 50% of proposers spend more than $5,000 on an engagement ring (Wedding Wire)
- In 2019, the average cost of an engagement ring band set for the bride is priced at an average of $6,113, while the groom’s band costs 87% less at around $468 (Diamond Nexus)
- 80% of brides admit to dropping hints about their ring preferences (Wedding Wire)
- The couples who opt for pre marital counseling report a 30% stronger marriage than other couples who tie the knot (WebMD)
According to Wedding Wire, these are the most popular days to get engaged:
- Christmas Day – 12/25
- Christmas Eve 12/24
- New Year’s Day 1/1
- Sunday before Christmas Eve 12/22
- Valentine’s Day 2/14
Wedding Fun Fats: Humanist marriages are not legally recognised and the couple must opt for an additional ceremony for the marriage to be legally valid. However, their number and popularity is on the rise in many cultures.
Engagement Ring Preferences
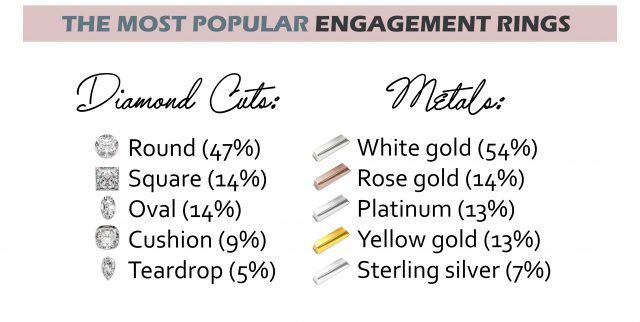
According to The Knot’s 2019 Jewelry and Engagement Study, the round cut is still on top for many couples when it comes to engagement rings, followed by the square princess cut and the more modern alternative: oval. When it comes to metals, newlyweds prefer white gold, while rose gold holds the second position.
The Top Engagement Ring Cuts:
- Round (47%)
- Princess / square (14%)
- Oval (14%)
- Cushion (9%)
- Pear / teardrop (5%)
The Top Engagement Ring Metals:
- White gold (54%)
- Rose gold (14%)
- Platinum (13%)
- Yellow gold (13%)
- Sterling silver (7%)
The Top Engagement Ring Gems:
- Diamonds (86%)
- Other precious stones (moissanite, sapphire, morganite) (10%)
- Colored diamonds (3%)
- No center stones (1%)
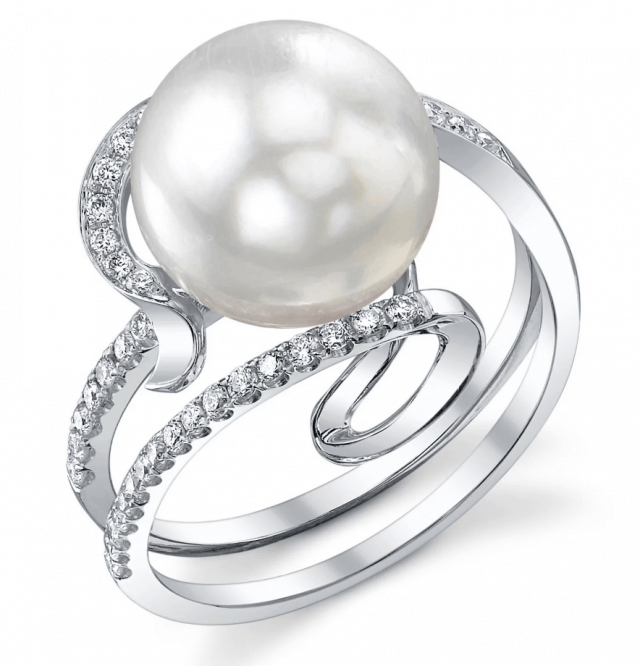
GEM SPOTLIGHT:
Tie the knot in style! And when it comes to style, it doesn’t get classier than pearl jewelry, featuring Akoya Pearls, Freshwater gems, South Sea or Tahitian. Engagement rings with alternative gems have been gaining more and more popularity in the recent years. Not only are alternative June birthstone rings more cost-effective, but rings featuring precious stones are highly unique. As a perfect match for pearl bridal earrings or bridesmaid earrings, shop from our collection of Pearl Engagement Rings, featuring diamond-enriched pearl rings in premium settings.
Wedding Fashion Stats
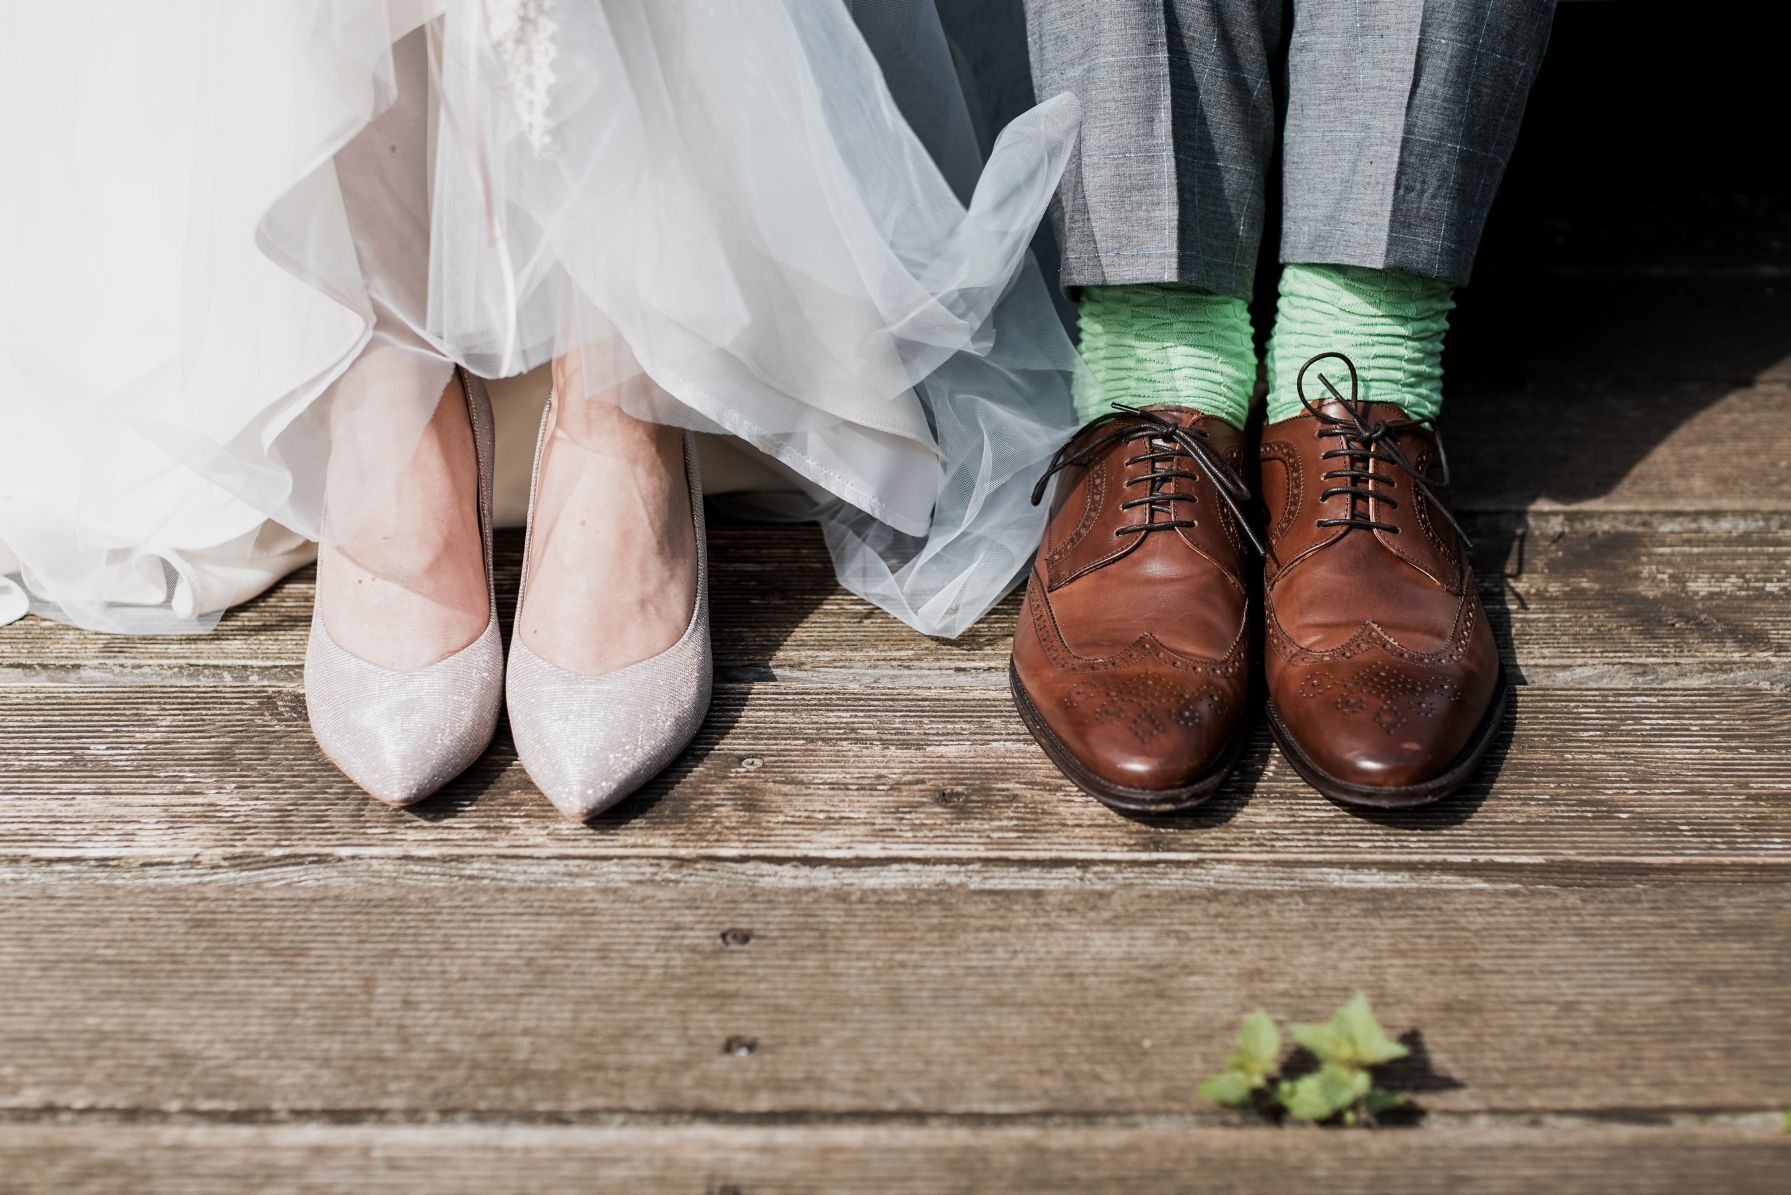
Picking out the right kind of wedding dress is nothing short of challenging. When it comes to tying the knot in style, every detail matters – from the bling to the frock. See the numbers, facts and figures behind wedding fashion below.
- The average cost of a wedding dress in 2019 was $1,600 (The Knot)
- In 2020, brides paid an average of $1,631 for a dress, including alterations (Brides)
- Most brides who tie the knot will spend between $500 to $4,000 on a wedding dress (Brides)
- Most brides (31%) try on an average of 4-7 dresses before picking the one (Bridal Guide)
- More than 50% of female wedding bands are made of white gold (Wedding Wire)
- Tungsten is the most popular metal for men’s wedding bands at 23% (Wedding Wire)
- In 2017, the global market value of wedding dresses was reported to be worth 2.86 billion U.S. dollars (Statista)
- The top seller of wedding dresses in the United States is David’s Bridal, representing a 28% market share (Brandon Gaille)
Wedding Dress Preferences
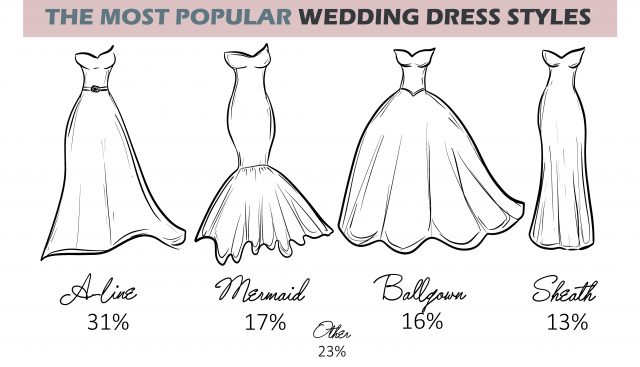
According to Popsugar, brides prefer the universally flattering fit and flare cut for their bridal gown. Here are the most popular choices by silhouette, followed by the average costs for wedding gowns.
- A-line (31%)
- Mermaid (17%)
- Ballgown (16%)
- Sheath (13%)
- Other silhouettes (23%)
How Much Do Brides Who Tie the Knot Spend on Their Wedding Dress?
- Under $2,000 – 68%
- Between $2,000 and $2,999 – 22$
- More than $3,000 – 10%
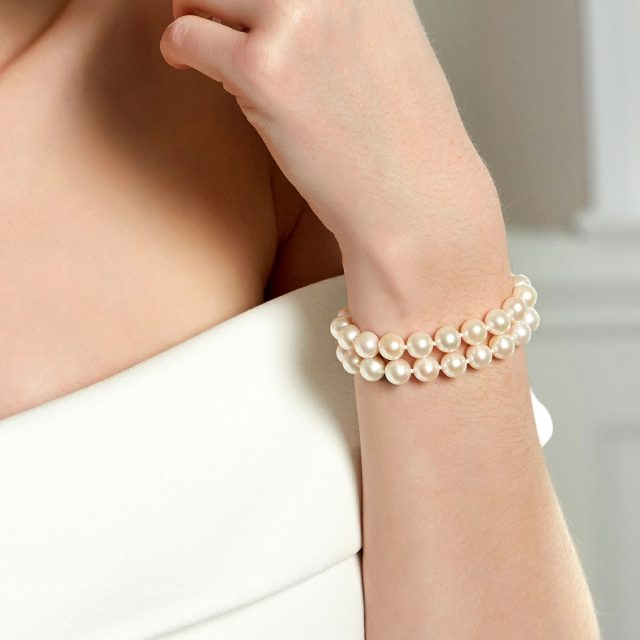
JEWELRY SPOTLIGHT:
Whether you choose a princess or a mermaid style dress, the right kind of wedding jewelry has the power to elevate your bridal ensemble. For a truly timeless bridal look, opt for elegant Pearl Bracelets. Discover our white, off-white, peach or pink bracelets and bridal & bridesmaid jewelry in dainty or statement pearls – and in modern or classic designs.
Wedding Fun Facts: Wedding Cake Statistics
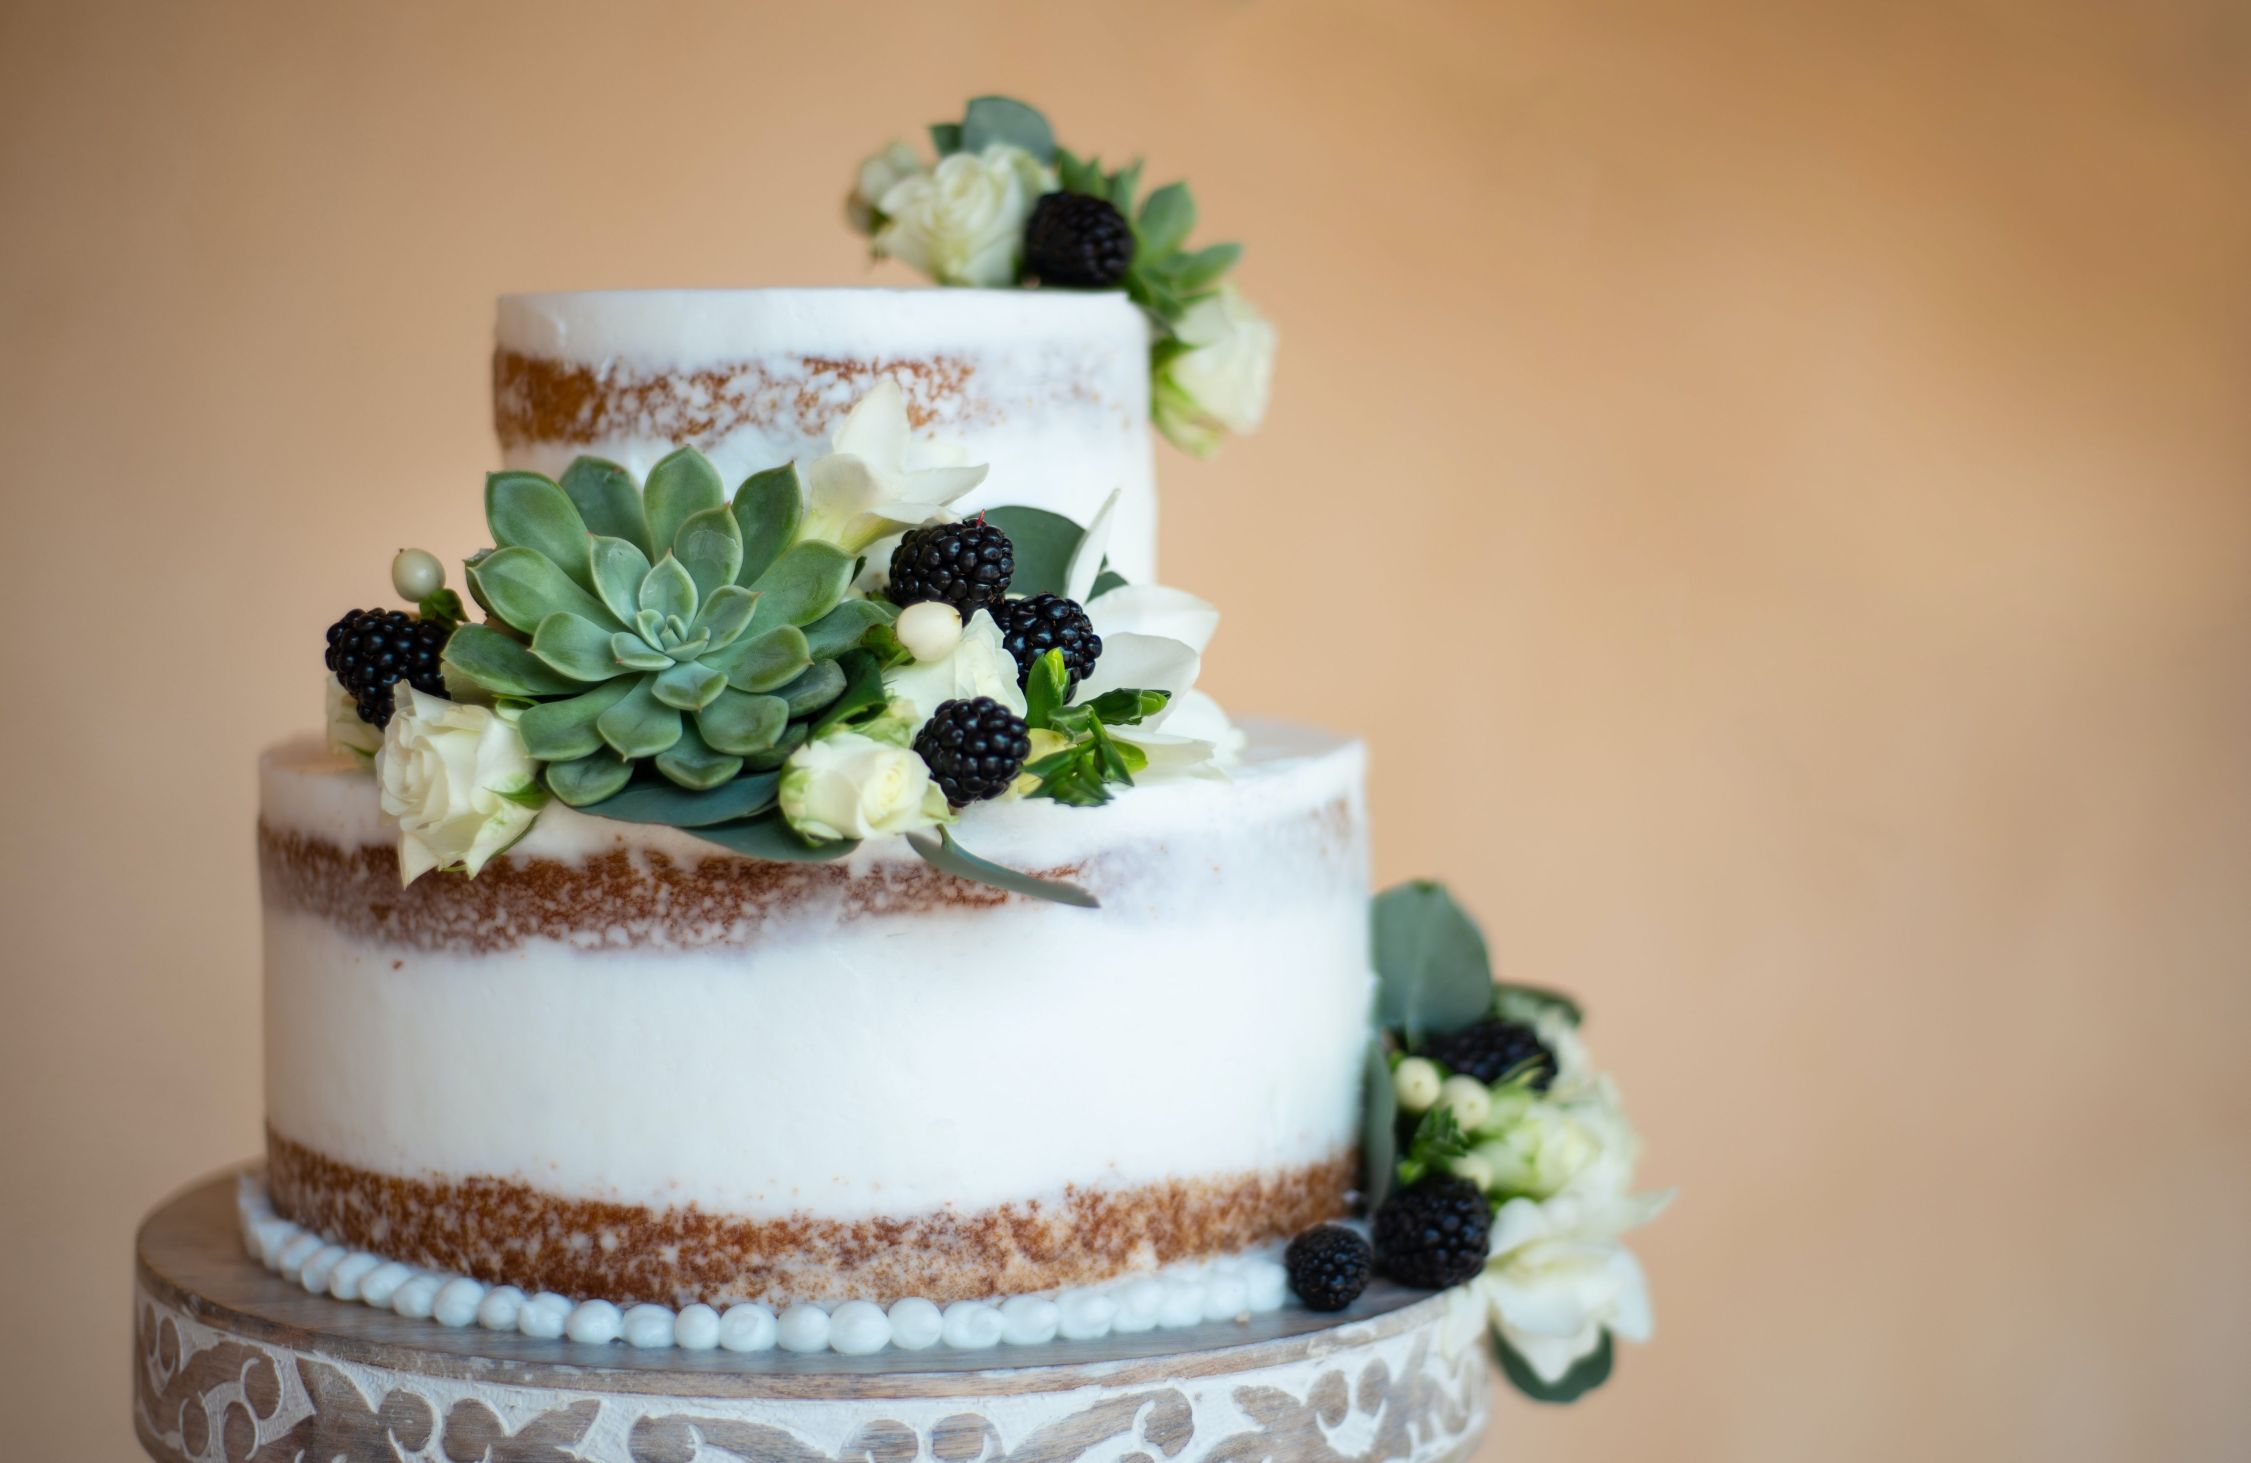
The trends are always changing when it comes to wedding food, but some things stay the same for decades. Wedding cakes are a major moment of any reception and they come with their own trends, price tags and… flavors.
- In 2020, the average cost of a wedding cake slice is $3.59 (based on a statistic by Wedding Stats)
- In other words, an average cake for $150 people will cost between $445-$631 (Wedding Stats)
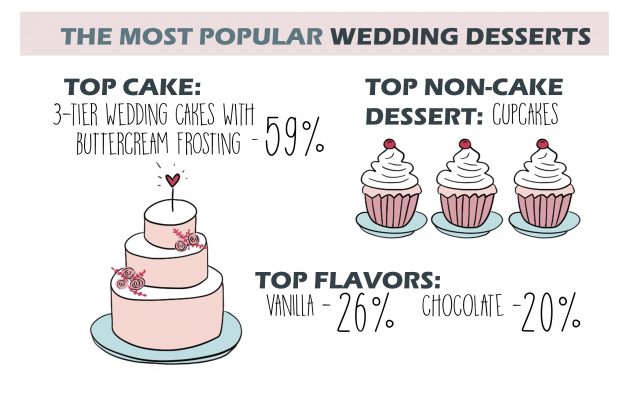
- The most popular wedding cake option is the classic tiered cake with buttercream frosting (Wedding Stats)
- Between 2010 and 2019, vanilla was the top wedding cake flavor choice – picked by 26% of couples (The Black Tux)
- Chocolate was the second most popular choice (20%), followed by red velvet (14%) (The Black Tux)
- Most couples (59%) pick a 3-tiered wedding cake (The Black Tux)
- 31% of couples spend less than $100 on their wedding cake (The Black Tux)
- 83% of couples order their wedding cake from their local bakery (The Black Tux)
- The most popular non-cake wedding desert is cupcakes (The Black Tux)
- Wedding Fun Facts: Cookies were the most popular non-cake wedding desert for almost 4 decades, between 1970-2009 (The Black Tux)
- 83% of couples opt to have a cake cutting ceremony during their wedding (Wedding Wire)
Wedding Trends and Entertainment – Facts and Statistics
Tying the knot wouldn’t be as fun without all the music, the entertainment and the little ceremonies and rituals that create magic. Here are a few wedding fun facts on wedding moments, trends, music and more:
- 79% of couples who tie the knot choose to incorporate their wedding colors into their floral arrangements (Wedding Wire)
- 21% of couples choose a banquet hall for their wedding, while 18% choose a rustic barn or farm and 12% opt for a historical building to share their vows in (Wedding Wire)
- 60% of couples opt for a flower girl and/or ring bearer (Wedding Wire)
- Despite tradition, 46% of couples see their partner before the marriage ceremonies (Wedding Wire)
- 38% of couples write personal letters to each other to be read on their wedding day (Wedding Wire)
- 91% of couples decided to perform a first dance (Wedding Wire)
- Guests are the number one priority for the couple, with %72 of them stating that making sure their guests had a good time was the most important aspect (The Knot)
- 35% of couples chose unique hashtags for their guests to post on social media (Wedding Wire)
- In 2020, the average cost of a wedding band falls between $3097-$3617 (Wedding Stats)
- When it comes to wedding DJs, the costs are between $875-$1101 (Wedding Stats)
- The average wedding band consists of 4 members who sign up for a 4-hour performance (Wedding Stats)
Spotify looked at thousands of wedding playlists and complied a list of the most popular musical choices for the first dance:
- “Thinking Out Loud” by Ed Sheeran
- “At Last” by Etta James
- “You Are the Best Thing” by Ray LaMontagne
- “All of Me” by John Legend
- “A Thousand Years” by Christina Perri
- “Make You Feel My Love” by Adele
- “I Won’t Give Up” by Jason Mraz
- “Everything” by Michael Bublé
- “Better Together” by Jack Johnson
- “Amazed” by Lonestar
According to Wedding Wire, these are the most popular Wedding Dates of 2020:
- October 10, 2020
- June 20, 2020
- September 19, 2020
- October 17, 2020
- September 12, 2020
Statistics on Destination Weddings

Tying the knot in a different country – preferably one that comes with an aura of exoticism and Instagram-worthy landscapes – has become a popular trend in the recent years. So popular that these days, 25% of weddings are destination weddings. But apparently, nothing beats a quick eloping adventure in Las Vegas for couples who want to tie the knot without the hassle. Here are some stats and facts on destination weddings:
- The average budget for a destination wedding is around $32,000 according to The Knot and $35,000 according to Brides
- There are around 350,000 destination weddings performed every year (Condor Ferries)
- The number is equivalent to 25% of all weddings in the US (Condor Ferries)
- The most popular destination weddings in the USA take place in Nevada, Florida and California (Group Travel)
- Outside of the US, the top destination wedding locations for couples who tie the knot are Caribbean, Mexico and Hawaii (Group Travel)
- Destination weddings are big business, summing up around $16 billion in annual spending (Ampers and Travel)
- 90% of couples cite climate as the top reason for choosing a destination wedding (Condor Ferries)
- The vast majority of couples (80%) who opt for destination weddings have been married before (Ampers and Travel)
- 50 is the average number of guests at a destination wedding (Bridal Guide)
Honeymoon Statistics

The engagement period is over, wedding was a hit, the stress is gone and now’s the time for relaxation and enjoying each other’s company. Ready to jet off to an exotic location after you tie the knot? Here are a few fun facts and stats from industry experts on how newlywed couples decide to spend their honeymoons.
- According to a study conducted on hundreds of US couples, Hawaii is the most popular honeymoon destination (Honeymoon Goals)
- Couples who tie the knot spend a total of around 5.1 weeks planning their honeymoon (Honeymoon Goals)
- On average, couples book their honeymoon 8 weeks after getting engaged (Honeymoon Goals)
- An average, 1.4 million people go on honeymoon each year in the US (Honeymoon Goals)
- The average couple in US spends 3 times more on their honeymoon than on a regular vacation (Ampersandtravel)
- 29% of couples decide to go on a minimoon or a smaller size trip instead of the standard honeymoon (The Knot)
- 88% of couples who opt for a minimoon instead of a honeymoon choose a destination within the country (The Knot)
- The average cost of a honeymoon is $4,466 (Brides)
- In 85% of the cases, the bride is the one who plans the honeymoon (Honeymoon Goals)
- 75% of newlyweds go on honeymoon within the first week after they tie the knot (Honeymoon Goals)
- 15% out of all honeymooners are what is called ‘luxury’ honeymooners (Honeymoongoals)
- Luxury honeymooners spend on average $9,950 for the vacation of their dreams (Honeymoongoals)
- 62% of couples pay for their honeymoon with their own money (Honeymoongoals)

JEWELRY SPOTLIGHT:
There’s nothing quite like traveling with your love to the exotic destination of your dreams. From the daily adventures to your picture-perfect beach outfits, every detail counts when it comes to enjoying the vacation of a lifetime. Glam up your honeymoon arsenal with a pair of Pearl Earrings or Mother of Pearl Jewelry, perfectly suited both for beach looks and romantic candlelight dinners. Whether you opt for classic stud earrings or drop earrings enriched with diamonds, you’re sure to shine on the vacay of your dreams.
The ancient Celtic practice known as the Handfasting ceremony is no longer legally recognised as in the medieval era, but it’s a cherished practice in many cultures, where the actual knot symbolizes the binding of two lives.
Conclusions
Each year, over 2 million couples tie the knot in the US alone. As an industry that generates on average $60 billion dollars per year, tying the knot is a big deal – on all accounts. There’s a lot of money involved in the special day, from the rings and the fashion to the wedding ceremony and the honeymoons. More and more studies show that the wedding industry shows no sign of slowing down, although some stats indicate that a significant number of modern couples gravitate towards alternative trends and more frugal weddings.

- Your Ultimate Guide on the Coquette Aesthetic - April 8, 2024
- Strings Attached: Justin Timberlake Goes Pearlcore on SNL - January 31, 2024
- 39 Types of White Gemstones: Properties, Uses and Benefits - November 22, 2023